Using the MNIST database in Stata
Posted on February 08, 2018
Historically, image recognition has been one of the major application area of machine learning. Many advanced technologies today incorporate algorithms for recognizing handwritten letters and digits. The task poses challenges beyond the scope of standard statistical methodology due to the structure and volume of image data. To handle image data effectively, a complex hierarchical model is needed to account for distant pixel correlations.
In a subsequent post I will demonstrate an application of a multilayer perceptron model in Stata for classifying handwritten digits from the MNIST database, [1]. Here I will introduce the database and describe some of its features.
To load the training MNIST dataset in Stata type:
. use http://www.stata.com/users/nbalov/datasets/mnist-trainSee this post for classification example using the MNIST database.
MNIST database
The MNIST database, which stands for Modified National Institute of Standards and Technology, is a collection of images of handwritten numerals. It is a popular benchmark dataset used for evaluation of image recognition systems. A substantial list of existing statistical and machine learning classification algorithms have been tested and evaluated on MNIST. Yann LeCun, Corinna Cortes, and Christopher Burges support a website that provides current benchmark results and literature.
I have converted the MNIST database into two Stata datasets, mnist-train and mnist-test. The training dataset, mnist-train, contains 60,000 images. The test dataset, mnist-test, contains 10,000 images. Each image has dimensions 28x28 with total of 784 pixels. The image pixels are stacked horizontally and are represented by the variables v1 to v784.
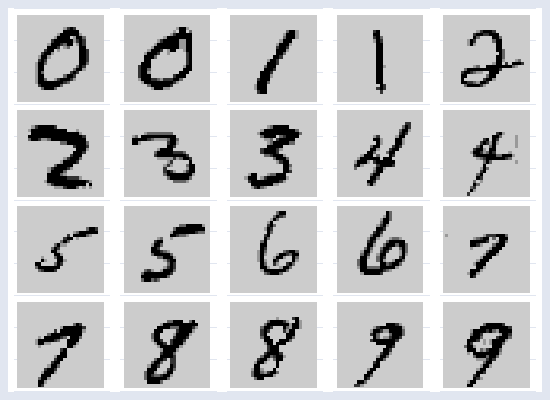
The original images are monochrome and are encoded using 1 byte per pixel. In the Stata datasets, the images have been reformatted so that each pixel is represented by a float number in the [0,1] range. The variable y is the label variable with values from 0 to 9 corresponding to the digit represented in the image. In Figure 2 you can see some examples from the training dataset.
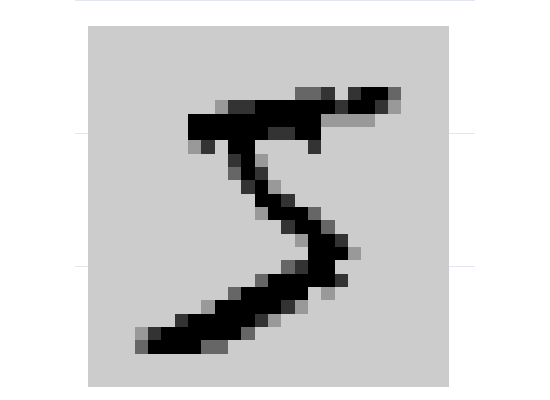
Visualizing individual images is unfortunately a bit cumbersome for it requires some manipulations with the dataset. I need to extract an individual record and expand its pixel values in a long-format creating a new dataset. Then can I use the twoway contour command with the heatmap option to draw it. The following program can be used to create a graph displaying the ndigit record from the training dataset.
program draw_test_digit
	args ndigit

	use mnist-train, clear

	quietly drop y
	quietly keep if _n==`ndigit'
	quietly gen y = 1

	quietly reshape long v, i(y) j(x)

	quietly replace y = 28-floor((x-1)/28)
	quietly replace x = x - 28*(28-y)

	quietly twoway (contour v y x, crule(intensity) ecolor(black) ///
	    clegend(off) heatmap),                                    ///
	    yscale(off) xscale(off) legend(off)                       ///
	    graphregion(margin(zero)) plotregion(margin(zero))        ///
	    graphregion(color(white)) aspectratio(1) nodraw           ///
	    name(d`ndigit', replace)

end
For example, I can display the first record from the training dataset, seen in Figure 1, which happens to be the digit 5.
. draw_digit 1
. graph combine d1
I can also select a group of digits and display them in one combined graph, see Figure 2.
. local list 2 22 4 15 17 29 31 50 10 54 12 48 33 84 30 80 56 98 34 88
. local disp_list
. foreach ndigit of local list {
	draw_digit `ndigit'
	local disp_list `disp_list' d`ndigit'
  }
. graph combine `disp_list'


Clearly, recognizing the numerals in these images is not a challenge to a human. The question is, can we describe the human perception process as an algorithm accessible to machines?
-
Y. LeCun, L. Bottou, Y. Bengio, and P. Haffner (1998). Gradient-Based Learning Applied to Document Recognition. Proceedings of the IEEE, 86(11), 2278-2324. ↩